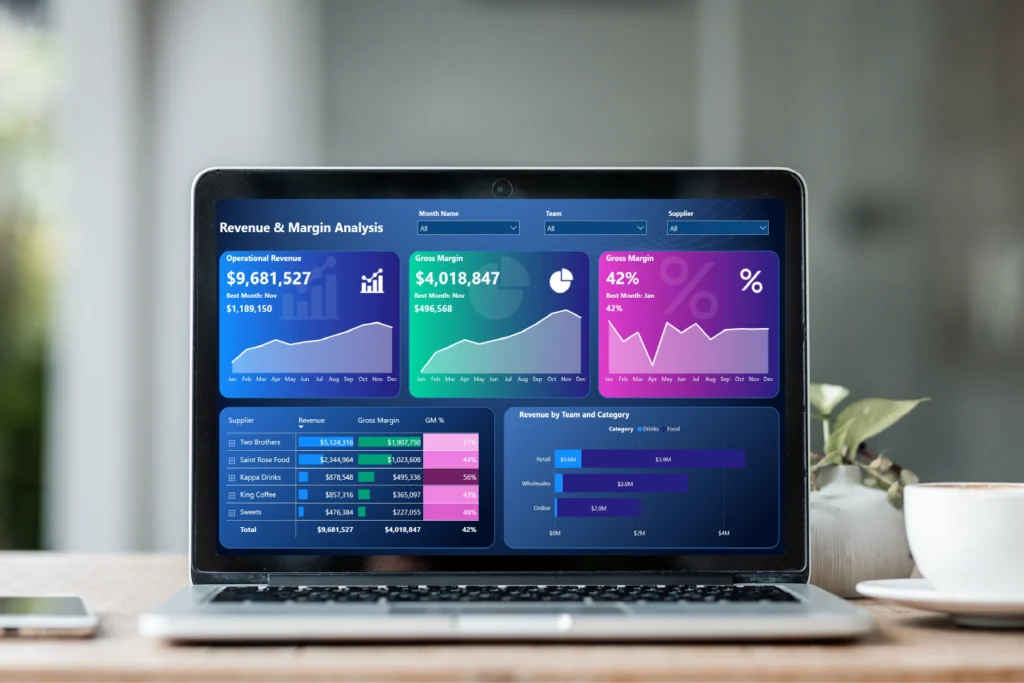
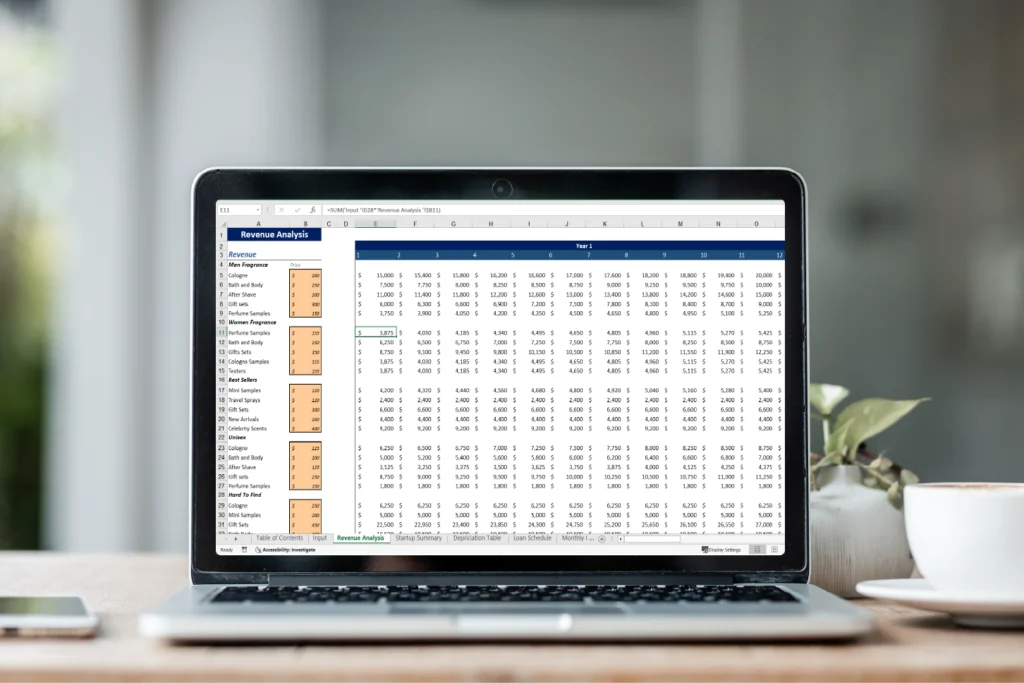
In many businesses, valuable data remains unutilised due to a lack of effective visualisation. At Easy Insight, we specialise in transforming complex datasets into clear, actionable insights through advanced data visualisation techniques.
We believe data visualisation is more than just adding colour and design; it’s about making data tell a story.


Creation of bespoke dashboards tailored to specific business needs, displaying critical metrics at a glance
Development of dynamic reports that allow users to drill down and interact with the data for deeper insights on desktop, tablet or mobile.
Crafting detailed, multi-page reports that allow for in-depth analysis, ideal for businesses needing comprehensive printed or PDF reports.
Reviewing and enhancing existing visualisations to ensure they're effective, accurate, and user-friendly
Microsoft Power BI is a market-leading analytics tool, consistently positioned as a top contender in Gartner’s Magic Quadrant for 16 years. Celebrated for its seamless integration with Microsoft services and innovative features, Power BI provides robust data solutions for businesses, ensuring effective decision-making backed by its trusted reputation.


Data visualisation is the art and science of translating complex data into visual formats, such as charts and graphs. This makes it easier to understand, analyse, and make informed decisions.
Visualising your data can uncover hidden trends, provide clarity on complex issues, and help you make data-driven decisions. It’s a valuable tool for any business wanting to stay ahead in today’s competitive market.
Data visualisation turns intricate data into comprehensible visuals, streamlining the decision-making process. By presenting data in charts or graphs, one can quickly glean insights, pinpoint trends, and communicate findings effectively. This clarity not only speeds up decision-making but also ensures that choices are evidence-based, minimising guesswork.
There are a wide range of techniques to visually represent data, aiding in clearer understanding and interpretation. Common methods include bar charts, pie charts, line graphs, scatter plots, and histograms. More advanced methods encompass heatmaps, treemaps, and geographic maps. Each method is designed to present data in a manner that best suits its nature and the intended audience.
In data visualisation, there’s no universal best tool. Your ideal choice hinges on specific requirements and prior experience. Microsoft Power BI is a market front-runner, especially for businesses using Microsoft products, offering both advanced analytics and user-friendly design at a very competive cost. However, for more detailed visualisation, Tableau or QlikView might be better suited. It’s crucial to weigh up your business objectives, budget, and skill level before deciding.
Data visualisation is used by a wide range of professionals across various industries. From business leaders making informed decisions, marketing teams analysing campaign performance, to BI consultants like us at Easy Insight, visualising data helps in simplifying complex information. It’s essential for anyone looking to gain quick insights, identify patterns, and make data-driven decisions. Whether you’re in finance, healthcare, retail, or any other sector, data visualisation tools can be a game-changer for your operations.
Absolutely. Data visualisation offers a significant return on investment for businesses. By translating complex data into clear, visual formats, it aids in faster decision-making, spotting trends, and identifying areas of improvement. As a result, businesses can save time, reduce costs, and capitalise on new opportunities more swiftly. When implemented effectively, data visualisation tools can lead to smarter business strategies and increased profitability. It’s a worthwhile investment for any business.
Yes, you can outsource your data visualisation requirements to us. We specialise in providing expert BI consultancy services, leveraging a decade of experience with Microsoft BI tools. Outsourcing to us ensures you receive top-quality visualisations tailored to your business needs, all while benefiting from competitive pricing. Trust in our expertise to transform your data into actionable insights efficiently.
Contact us today to explore how we can assist you in crafting compelling data visualisations that provide clear and actionable insight.
We use cookies to enhance your browsing experience, analyse site traffic, and personalise content. By clicking "Accept All," you consent to our use of cookies. You may click "Preferences" to choose which cookies you allow or "Only Essential" to use only necessary cookies. For more information, please see our Privacy Policy.